PROJECT TITLE: Its All About The Stroop!
DESCRIPTIVE STATISTICS
|
DRIVING QUESTION
How can we as statisticians collect, study, analyze and present data on a real-world topic?
|
GUIDING QUESTIONS
|
|
CCSS Addressed
|
|
STUDENT OBJECTIVES: |
GUIDING QUESTIONS |
|
|
ENTRY EVENT
THE STROOP TEST
In psychology, the Stroop effect is a demonstration of interference in the reaction time of a task. The famous "Stroop Effect" is named after J. Ridley Stroop who discovered this strange phenomenon in the 1930s.
In psychology, the Stroop effect is a demonstration of interference in the reaction time of a task. The famous "Stroop Effect" is named after J. Ridley Stroop who discovered this strange phenomenon in the 1930s.
|
THE TASK
- Here is your job: name the colors of the following words. Do NOT read the words...rather, say the color of the words. For example, if the word "BLUE" is printed in a red color, you should say "RED". Say the colors as fast as you can. It is not as easy as you might think! WHY? The words themselves have a strong influence over your ability to say the color. The interference between the different information (what the words say and the color of the words) your brain receives causes a problem. There are two theories that may explain the Stroop effect:
|
ONLINE TEST
More experiments to try:
|
THE PRODUCT
|
Your GROUP will be graded on the following:
RUBRICS - How you will be graded
KNOWLEDGE AND SKILLS
|
INDIVIDUALLY you will be graded on the following:
• Written Analysis of Data (MLA Style) • Box-and-whisker plots from data • Histograms from data Written Analysis- Each MEMBER of your team should write up their own analysis.
PRESENTATIONPresentation Questions you will receive from your audience. Be Ready to Answer Them!
| ||||||||
LEARNING OUTCOMES
|
21st Century Skills
Collaboration: Partner data collection |
TASK 1: Create a statistics question. |
|
21st Century Skills
Critical Thinking: Create a question that will allow students to interpret data. |
The Project is MUCH easier when you choose quantitative data vs qualitative data.
| ||
|
Uses the statistical inquiry cycle to conduct investigations
|
ADDITONAL RESOURCES
What is descriptive Statistics: (slide show) http://www.slideshare.net/kemdoby/descriptive-statistics-8664485
Video Lessons: http://education-portal.com/academy/lesson/descriptive-and-inferential-statistics.html |
|
21st Century Skills
Presentation: Partner presentation Real-life relevance with relationships |
21st Century Skills
Other: Using technology in the classroom: graphing calculators and video cameras |
Math: Data Analysis and Probability
1. Summarize, Represent, and interpret data on a single count or measure variable
2. Summarize, represent and interpret data on two categorical quantitative variables
3. Interpret Linear Models
1. Summarize, Represent, and interpret data on a single count or measure variable
2. Summarize, represent and interpret data on two categorical quantitative variables
3. Interpret Linear Models
Final Exam: http://www.loudoun.k12.va.us/cms/lib4/VA01000195/Centricity/Domain/17182/Alg%201%20SOL%20A.10%2013.6%2013.8%20Measures%20of%20Central%20Tendency%20HW%20WS%20PDF.pdf
Final Exam 2:
http://www.tri-valley.k12.oh.us/userfiles/566/Classes/62972/Displays%20of%20Data%20Summary%2011%20pages.pdf
Final Exam 2:
http://www.tri-valley.k12.oh.us/userfiles/566/Classes/62972/Displays%20of%20Data%20Summary%2011%20pages.pdf
LESSON 1 - OVERVIEW |
Formative Assessments & Instructional Strategies |
|
Lesson 1: Organizing Data Using Matrices
Vocabulary - Matrix - Element - Scalar - Scalar multiplication Essential Understanding - you can use matrices to organize data. This may make it easier to perform calculations on the data. |
Required Tasks
OTHER Resources:
| ||||||
..... VIDEO TUTORIALS .....
|
|
|
|
LESSON 2 Overview |
Formative Assessments & Instructional Strategies |
|
CCSS: S.ID.B.5
Lesson 2: Frequency and Histograms I can make and interpret frequency tables and histograms. Vocabulary
Essential Understanding - There are many ways to organize and visually display data. Sometimes it is helpful to organize numerical data into intervals. |
REQUIRED TASKS
OTHER RESOURCES
HISTOGRAM: A Histogram is a graphical display of data using bars of different heights. It is similar to a Bar Chart, but a histogram groups numbers
| ||||||||
..... VIDEO TUTORIALS .....
|
|
|
http://education-portal.com/academy/lesson/frequency-relative-frequency-tables-definition-examples.html
LESSON 3 - Overview |
Formative Assessments & Instructional Strategies |
|
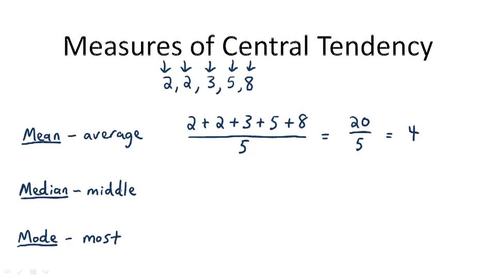
Lesson 3: Measure of Central Tendency and Dispersion
Vocabulary
Essential Understanding - You can use different measure to interpret and compare sets of data. |
Required Tasks
Additional Resources
| ||||||
..... VIDEO TUTORIALS .....
http://education-portal.com/academy/lesson/mean-median-mode-measures-of-central-tendency.html
|
|
|
LESSON 4 - Overview
|
Formative Assessments & Instructional Strategies |
|
Lesson 4: Box-and-Whisker Plots
Vocabulary
Essential Understanding - Separating data into subsets is a useful way to summarize and compare data sets |
Required Tasks
Additional Resources
Quiz: http://www.meridianschools.org/LHMS/Teachers/QT/ramossarah/Lists/Calendar/Attachments/497/Box%20and%20Whisker%20Plots%20Worksheet.pdf | ||||||
..... VIDEO TUTORIALS .....
|
|
|
LESSON 5 - OverviewLesson 5: Samples and Surveys
Vocabulary
Essential Understanding - When collecting data to solve a problem, you need to make sure that your methods are fair and that you accurately represent the results. |
Formative Assessments & Instructional Strategies
ADDITIONAL RESOURCES
Explain why, “Do you prefer delicious fruit or plain vegetables for a snack food?” is a biased survey question. Be able to state if the data is qualitative or quantitative data.
http://teachers.henrico.k12.va.us/pocahontas/obrien_s/pdfs/8Lqualitativevsquan.pdf Determine whether each sampling method is random, systematic, or stratified.
Notes: http://www.ssc.wisc.edu/~oliver/SOC357/Lectures%20and%20Notes/SampleTypesBigSlides.pdf | ||||||
LESSON 6 - OverviewLesson 6: Permutations and Combinations
Vocabulary
Essential Understanding = You can use counting methods to find the number of possible was to choose objectives with and without regard to order |
Formative Assessments & Instructional StrategiesRequired Tasks
ADDITIONAL RESOURCES
http://www.regentsprep.org/regents/math/algtrig/ats5/lcomb.htm http://www.glencoe.com/sec/math/algebra/algebra1/algebra1_03/study_guide/pdfs/alg1_pssg_G108.pdf http://www.makingmathematicians.com/docs/permutations_combinations_odds.pdf http://www.doe.virginia.gov/testing/solsearch/sol/math/a2/m_ess_a2-12.pdf http://download.nos.org/srsec311new/L.No.07.pdf | ||||||
LESSON 7 - Overview |
Formative Assessments & Instructional Strategies |
|
Lesson 7: Theoretical and Experimental Probability
Vocabulary
Essential Understanding
|
Required Task
Additional Resources
| ||||||
ADDITIONAL RESOURCES
- http://ktlmathclass.weebly.com/algebra-1-notes.html
- Video: http://www.virtualnerd.com/algebra-1/all/
- Worksheets: http://ktlmathclass.weebly.com/algebra-1-worksheets.html
