PROJECT TITLE: Its All About The Stroop! |
|
DESCRIPTIVE STATISTICS
|
DRIVING QUESTIONHow can we as statisticians collect, study, analyze and present data on a real-world topic?
GUIDING QUESTIONS
|
Opening Video |
|
CCSS Addressed
|
|
STUDENT OBJECTIVES:
GUIDING QUESTIONS
- Students will learn how to make, interpret, and compare box-and-whisker plots and histograms.
- Students will generate a question to analyze from data that they will collect.
- Each student will collect data appropriate to their question.
- Students will make an appropriate number, based on their question, of box-and-whisker plots and histograms from their group's collected data.
- Students will analyze their data in order to answer their question.
- Students will work collaboratively.
- Students will make document project using video, pictures, and written analysis.
GUIDING QUESTIONS
- How can collecting and analyzing data help you make decisions or predictions?
- How does a box and whisker plot help display data?
- How can you make and interpret different representations or data?
- How is probability related to real-world events?
- PROJECT SUMMARY
- The project is to create a question where students will a collect data, graph it and finally analysis their data.
- Statistics
- Find, use, and interpret measures of center and spread, including mean and interquartile range for given or derived data.
- Choose appropriate measures of central tendencies to describe given or derived data.
- Collect and Display Data
- Formulate questions and design experiments or surveys to collect relevant data.
- Identify situations in which it makes sense to sample and identify methods for selecting a sample that are representative of a population.
- Represent and interpret data using frequency distribution tables and box-and-whisker plots.
- Recognize distortions of graphic displays of sets of data and evaluate appropriateness of alternative displays.
- Data Analysis and Predictions
- Analyze data from frequency distribution tables and box-and-whisker plots using measures of center and spread and draw conclusions.
- Use observations about differences between two or more samples to make conjectures about the populations from which the samples were taken.
ENTRY EVENT
THE STROOP TEST
In psychology, the Stroop effect is a demonstration of interference in the reaction time of a task. The famous "Stroop Effect" is named after J. Ridley Stroop who discovered this strange phenomenon in the 1930s.
In psychology, the Stroop effect is a demonstration of interference in the reaction time of a task. The famous "Stroop Effect" is named after J. Ridley Stroop who discovered this strange phenomenon in the 1930s.
|
THE TASK
- Here is your job: name the colors of the following words. Do NOT read the words...rather, say the color of the words. For example, if the word "BLUE" is printed in a red color, you should say "RED". Say the colors as fast as you can. It is not as easy as you might think! WHY? The words themselves have a strong influence over your ability to say the color. The interference between the different information (what the words say and the color of the words) your brain receives causes a problem. There are two theories that may explain the Stroop effect:
|
ONLINE TEST
More experiments to try:
|
THE PRODUCT
|
Your GROUP will be graded on the following:
RUBRICS - How you will be graded
|
INDIVIDUALLY you will be graded on the following:
• Written Analysis of Data (MLA Style) • Box-and-whisker plots from data • Histograms from data Written Analysis- Each MEMBER of your team should write up their own analysis.
| ||||||
KNOWLEDGE and SKILLS
|
Presentation QuestionsPresentation Questions you will receive from your audience. Be Ready to Answer Them!
| ||
LEARNING OUTCOMES
|
21st Century Skills:
Collaboration: Partner data collection 21st Century Skills
Critical Thinking: Create a question that will allow students to interpret data. Uses the statistical inquiry cycle to conduct investigations
|
REQUIRED TASKS
TASK 1: Create a statistics question.
The Project is MUCH easier when you choose quantitative data vs qualitative data.
ADDITIONAL RESOURCES
What is descriptive Statistics: (slide show) http://www.slideshare.net/kemdoby/descriptive-statistics-8664485
Video Lessons: http://education-portal.com/academy/lesson/descriptive-and-inferential-statistics.html | ||
|
21st Century Skills
Presentation: Partner presentation Real-life relevance with relationships |
|
21st Century Skills
Other: Using technology in the classroom: graphing calculators and video cameras |
|
Math: Data Analysis and Probability
1. Summarize, Represent, and interpret data on a single count or measure variable 2. Summarize, represent and interpret data on two categorical quantitative variables 3. Interpret Linear Models |
LESSON 1 OverviewLesson 1: Organizing Data Using Matrices
Vocabulary - Matrix - Element - Scalar - Scalar multiplication Essential Understanding - you can use matrices to organize data. This may make it easier to perform calculations on the data. |
Formative Assessments & Instructional StrategiesREQUIRED TASKS
OTHER Resources:
| ||||||
LESSON 2 OverviewCCSS: S.ID.B.5
Lesson 2: Frequency and Histograms I can make and interpret frequency tables and histograms. Vocabulary
Essential Understanding - There are many ways to organize and visually display data. Sometimes it is helpful to organize numerical data into intervals. |
Formative Assessments & Instructional StrategiesREQUIRED TASK
OTHER RESOURCES
HISTOGRAM: A Histogram is a graphical display of data using bars of different heights. It is similar to a Bar Chart, but a histogram groups numbers into ranges
VIDEOSHow To Create a Tally and Frequency Table
How to create a Frequency Table with Qualitative Data!
http://education-portal.com/academy/lesson/frequency-relative-frequency-tables-definition-examples.html
| ||||||||
LESSON 3 OverviewLesson 3: Measure of Central Tendency and Dispersion
Vocabulary
Essential Understanding - You can use different measure to interpret and compare sets of data. |
Formative Assessments & Instructional StrategiesREQUIRED TASK
ADDITIONAL RESOURCES
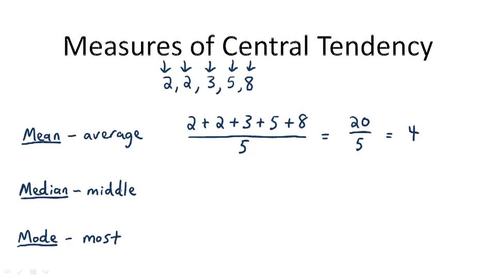
VIDEOShttp://education-portal.com/academy/lesson/mean-median-mode-measures-of-central-tendency.html
| ||||||
LESSON 4 OverviewLesson 4: Box-and-Whisker Plots
Vocabulary
Essential Understanding - Separating data into subsets is a useful way to summarize and compare data sets. |
Formative Assessments & Instructional StrategiesREQUIRED TASK
ADDITIONAL RESOURCES
Quiz: http://www.meridianschools.org/LHMS/Teachers/QT/ramossarah/Lists/Calendar/Attachments/497/Box%20and%20Whisker%20Plots%20Worksheet.pdf VIDEOS | ||||||
LESSON 5 Overview
Lesson 5: Samples and Surveys
Vocabulary
Essential Understanding - When collecting data to solve a problem, you need to make sure that your methods are fair and that you accurately represent the results. |
Formative Assessments & Instructional StrategiesREQUIRED TASK
ADDITIONAL RESOURCES
Explain why, “Do you prefer delicious fruit or plain vegetables for a snack food?” is a biased survey question.
Be able to state if the data is qualitative or quantitative data.
http://teachers.henrico.k12.va.us/pocahontas/obrien_s/pdfs/8Lqualitativevsquan.pdf Determine whether each sampling method is random, systematic, or stratified.
Notes: http://www.ssc.wisc.edu/~oliver/SOC357/Lectures%20and%20Notes/SampleTypesBigSlides.pdf | ||||||
LESSON 6 OverviewLesson 6: Permutations and Combinations
Vocabulary
Essential Understanding = You can use counting methods to find the number of possible was to choose objectives with and without regard to order |
Formative Assessments & Instructional StrategiesREQUIRED TASKS
ADDITIONAL RESOURCES
http://www.regentsprep.org/regents/math/algtrig/ats5/lcomb.htm
http://www.glencoe.com/sec/math/algebra/algebra1/algebra1_03/study_guide/pdfs/alg1_pssg_G108.pdf http://www.makingmathematicians.com/docs/permutations_combinations_odds.pdf http://www.doe.virginia.gov/testing/solsearch/sol/math/a2/m_ess_a2-12.pdf http://download.nos.org/srsec311new/L.No.07.pdf | ||||||
LESSON 7 OverviewLesson 7: Theoretical and Experimental Probability
Vocabulary
Essential Understanding
|
Formative Assessments & Instructional StrategiesREQUIRED TASK
ADDITIONAL RESOURCES
| ||||||
Additional Resources
http://ktlmathclass.weebly.com/algebra-1-notes.html
Video: http://www.virtualnerd.com/algebra-1/all/
Worksheets: http://ktlmathclass.weebly.com/algebra-1-worksheets.html
Video: http://www.virtualnerd.com/algebra-1/all/
Worksheets: http://ktlmathclass.weebly.com/algebra-1-worksheets.html
